

While HTML dashboards for SharePoint lists are exciting. Here’s how to implement them wisely.
Everyone is seeing what HTML dashboards can do as overlays to SharePoint lists and libraries.
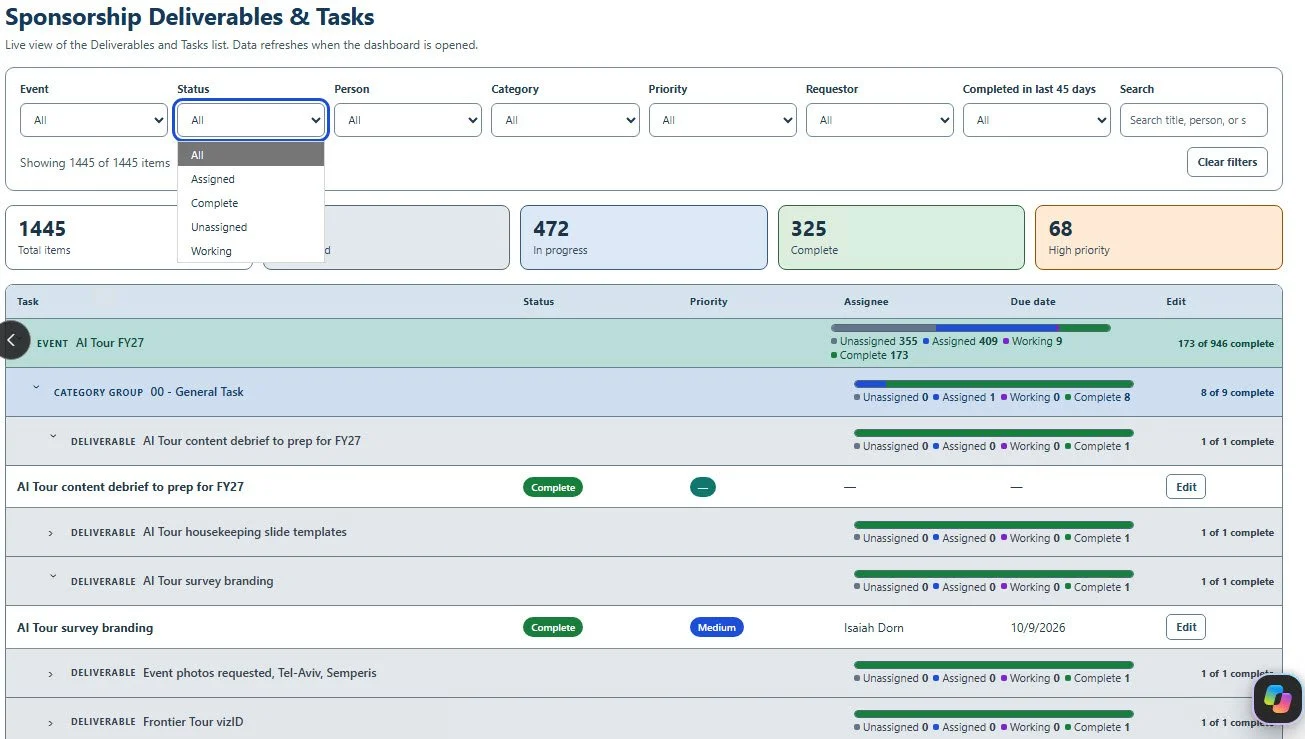
These dashboards bring real capabilities, but a few smart choices up front will save you headaches later. While using Copilot prompts to build them, keep these things in mind:
1️⃣ Store the HTML in its own dedicated library.
Prompt Copilot to create and maintain your dashboards as files in a separate library. If the prompt lives only in the list, you only have the current version. A separate file gives you version history and restore. It also lets your list designer copy the file and experiment independently, without cluttering a production list with development views.
2️⃣ Create more than a pretty dashboard.
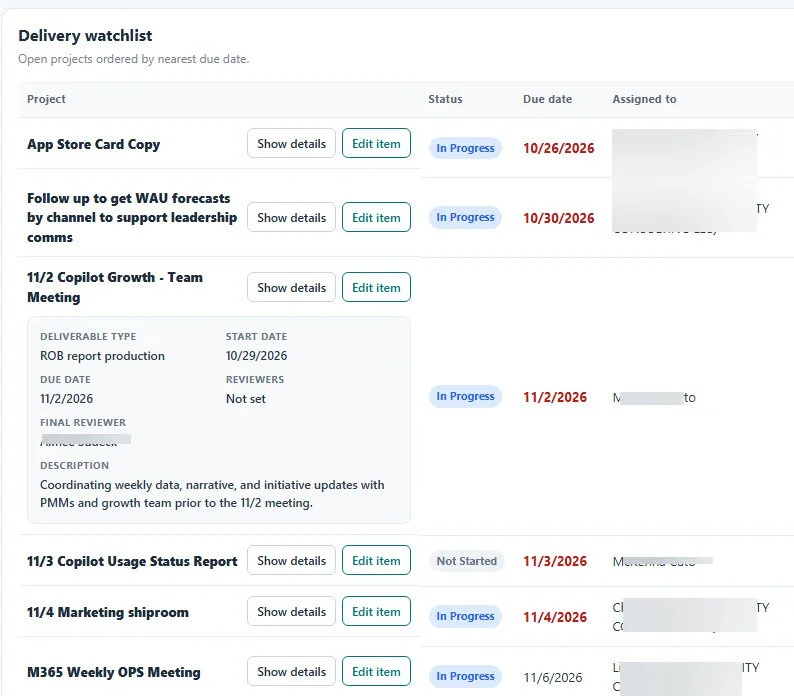
Build in the ability to add and edit items directly from the dashboard and make sure saving an item returns users to the dashboard, not the raw SharePoint list. It’s a much cleaner user experience.
3️⃣ Use real-time calculations (think Power BI measures).
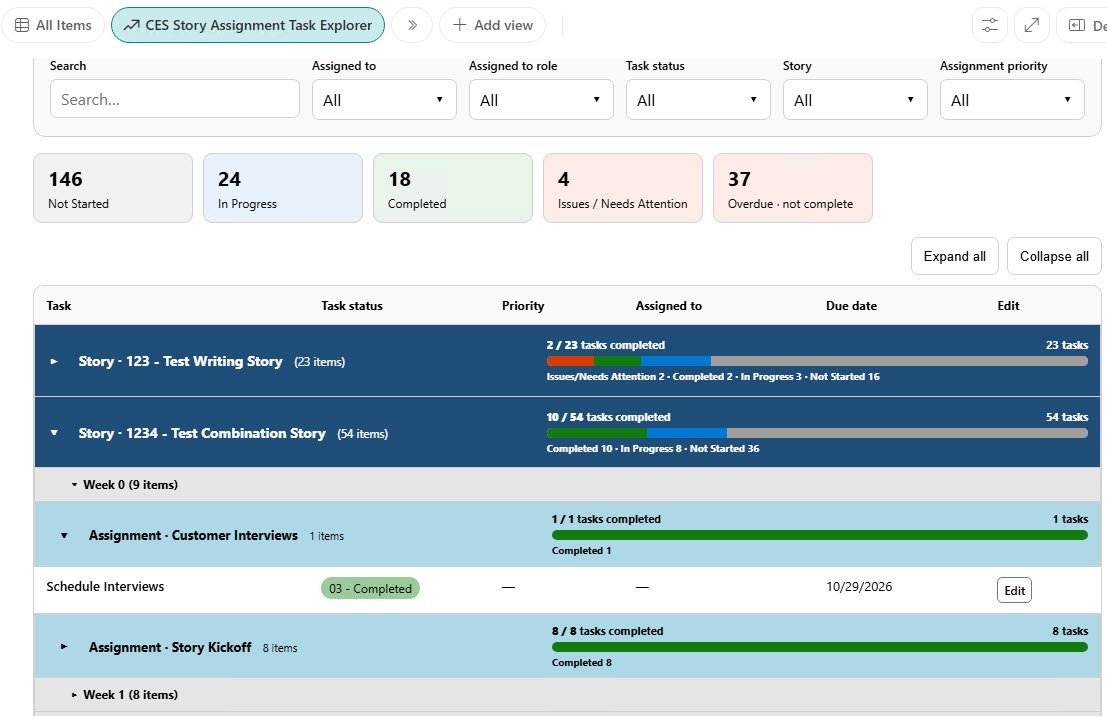
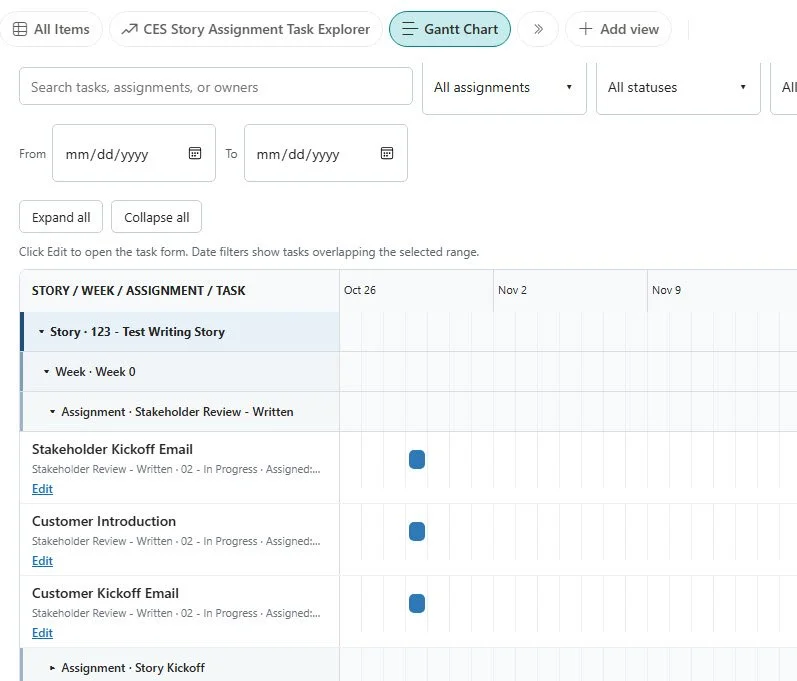
If you have assignments and tasks, your dashboard can show aggregates like “3 of 5 assigned tasks completed” or percent complete. Just know that some of these values live only in the dashboard, not in your list data.
4️⃣ Be deliberate about permissions.
By default, SharePoint gives members Edit permissions (which I still disagree with, @Microsoft). That lets members change columns, views, and other list settings.
With our clients, we separate those who create and maintain the list and its configuration from those who contribute data. I don’t need my entire team building and modifying HTML dashboards. Decide who configures and who contributes.